Real-time Data
Satellite, Radar, and METARs
Satellite
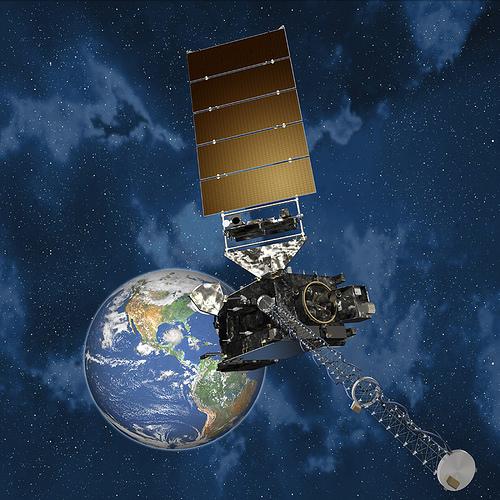
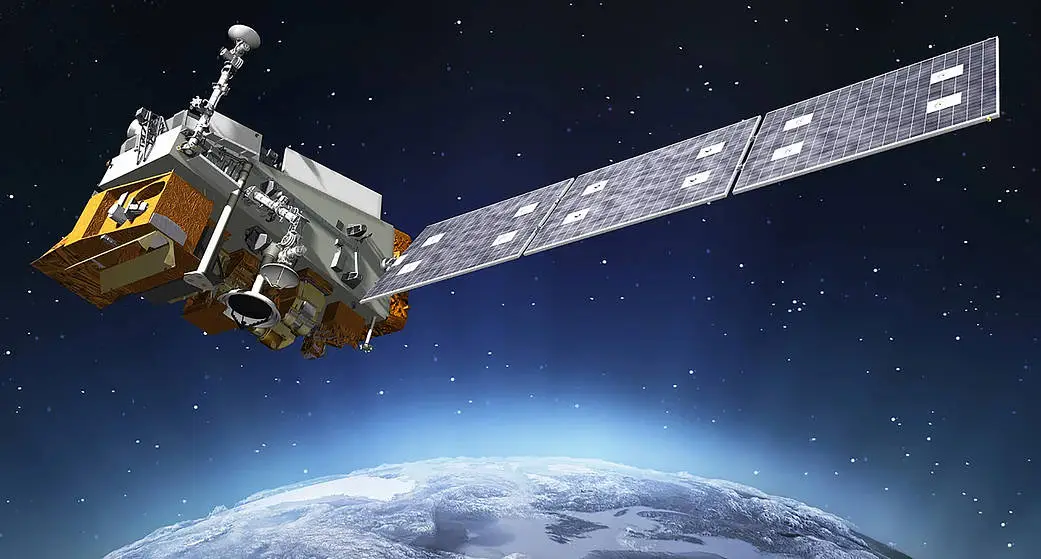
There are two main types of weather satellites orbiting the Earth: geostationary and polar. The geostationary satellite orbits the earth from west to east around the equator. The polar satellite orbits from north to south near the poles. The combination of these satellites taking images as they go around the Earth is how we get looped videos of real-time data to see what’s going on in the world. The data from these satellites can be visually presented in a handful of ways but let’s focus on three: visible, infrared, and water vapor.
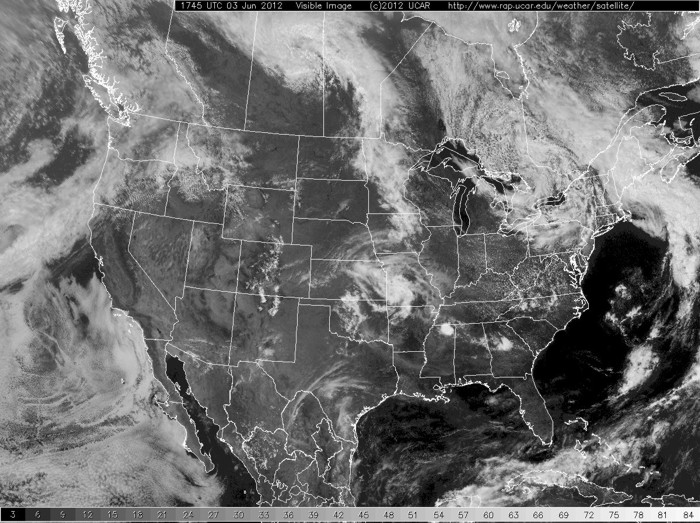
Visible (VIS) imagery takes light energy from the sun as it is reflected by Earth. This reflectance is known as albedo. The higher the albedo, the more light that is reflected into space, the lower the albedo the more energy is absorbed. This is helpful to determine cloud height: low clouds will appear a brighter white since they are mostly composed of water and reflect more sunlight, while high, thin clouds are less bright as they do not reflect nearly as much sunlight and thin clouds hold less moisture, and the difference between snow and fog: snow will stay static while fog will move slightly. Unfortunately, since VIS imagery is based on light, this is useless during the nighttime.
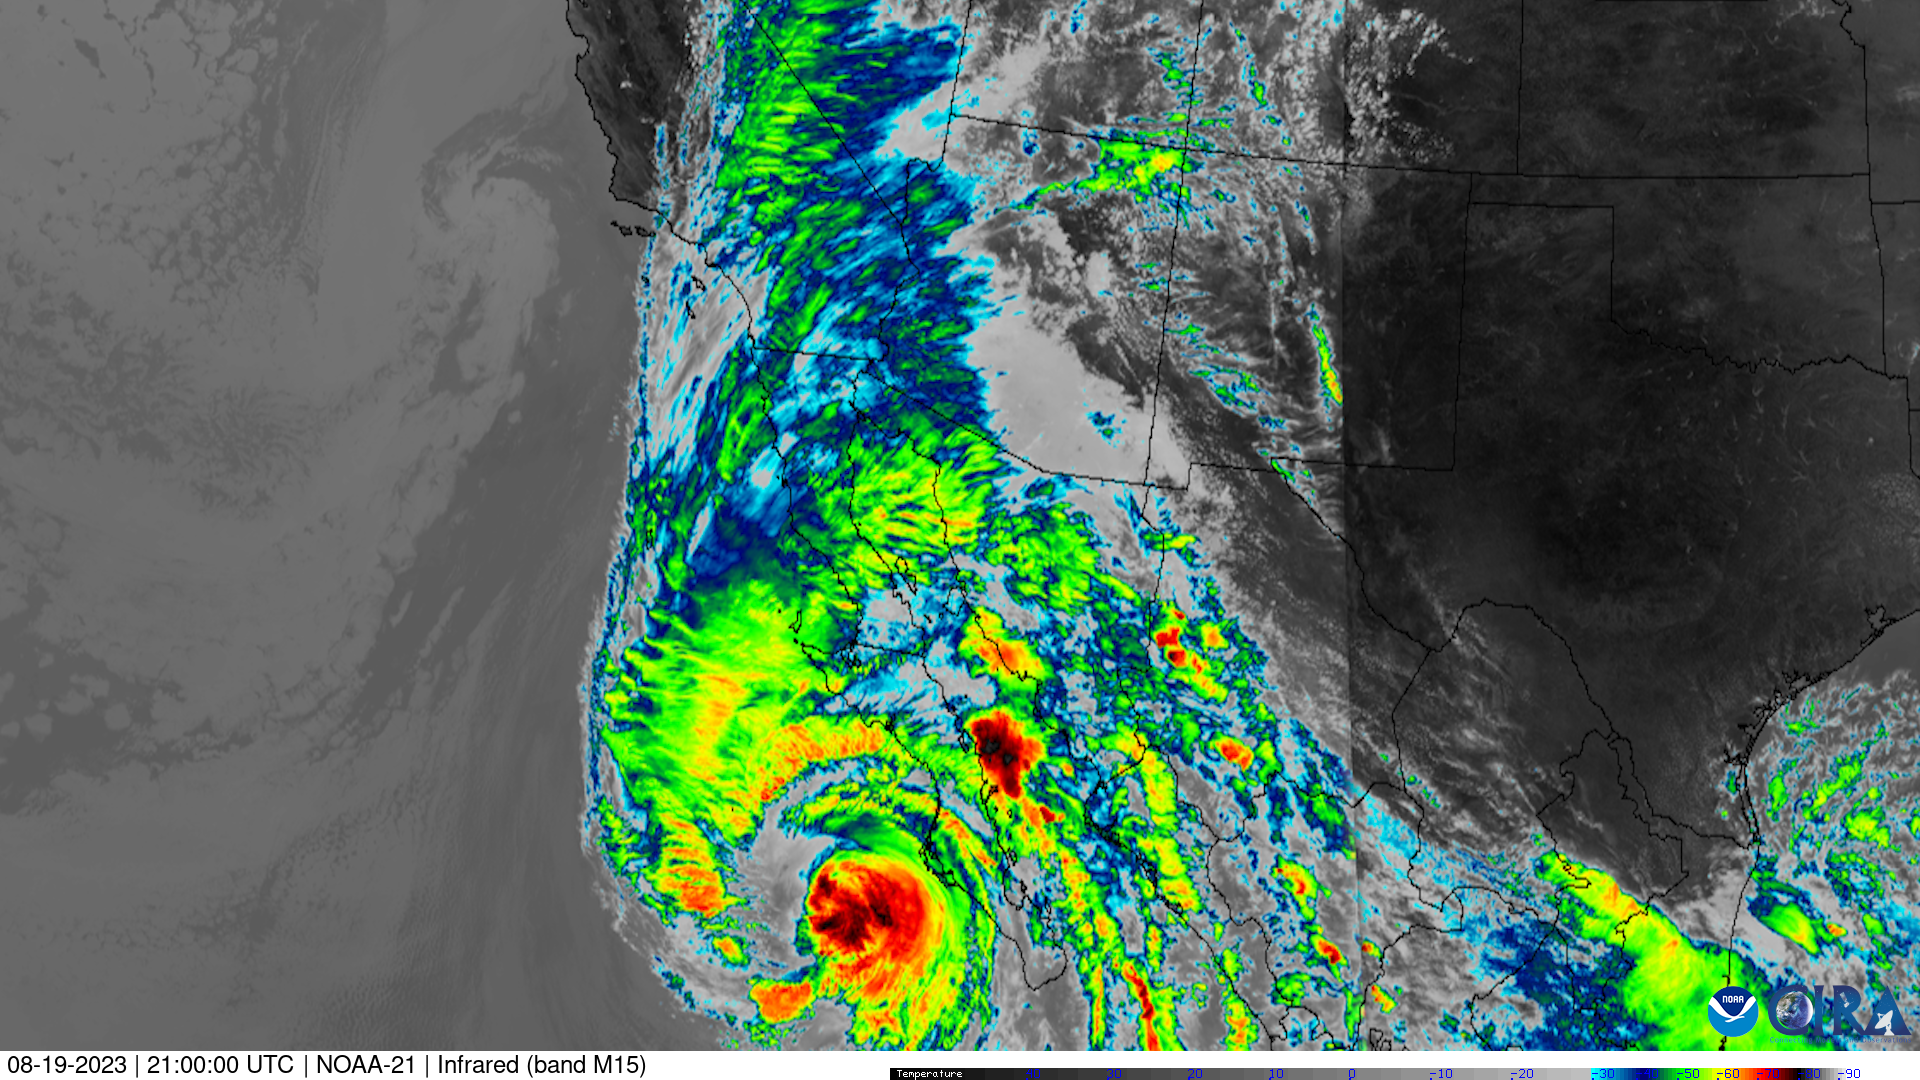
Infrared (IR) imagery is based on temperature. It measures the thermal radiation (IR) from the Earth’s surface and clouds. As you go up in the atmosphere, from the surface of Earth to space, the temperature gets increasingly cold. This is great for distinguishing from low (gray), medium (blue, green), or high (purple, red, black) cloud tops. Since it is an image from space, you can only see the cloud top and are unable to see where the cloud base begins. As it is based on temperature and not sunlight, this imagery is available both day and night.
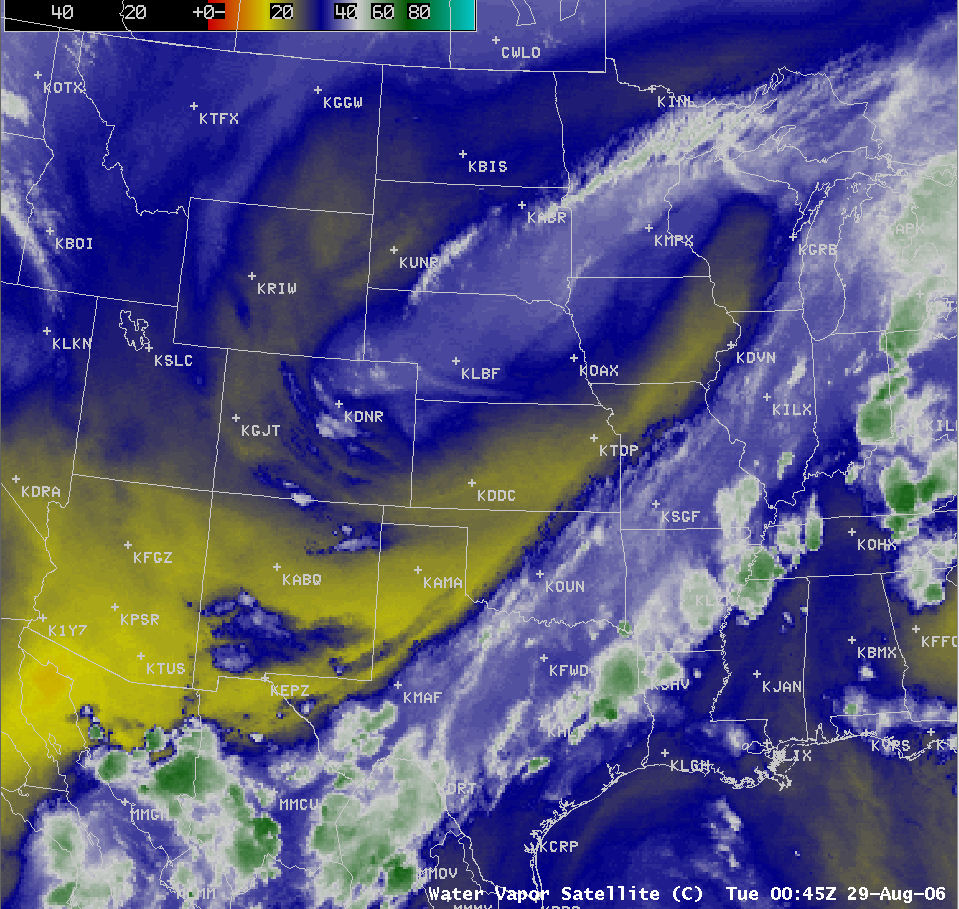
Water Vapor (WV) imagery is a type of IR imagery where it detects heat (IR) emitted from water vapor distribution in the middle and upper layers of the atmosphere. This is especially helpful for finding jet streams, particularly the Polar Front Jet (PFJ) which carries frontal systems that bring inclement weather, and dry slots; airstreams that transport dry air that can aid in severe weather formation.
Radar
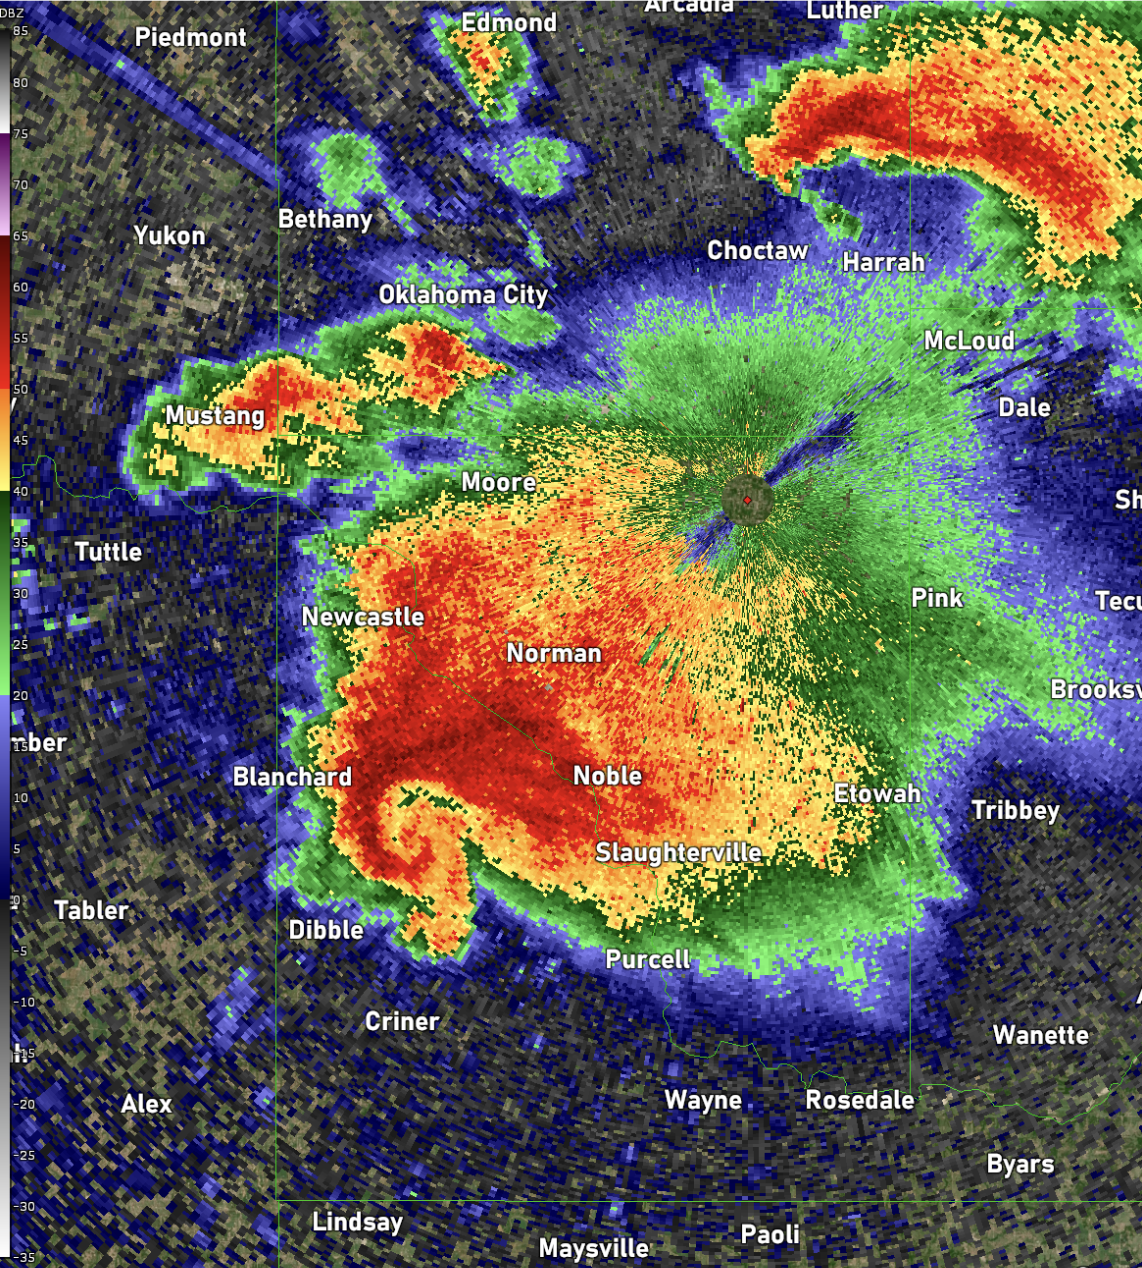
The Doppler radar is a type of radar that uses the doppler radar theory, measuring the velocity of an object through reflected radio waves. In short, imagine a circle (radar) shooting out a laser (beam), that laser hits an object (cloud), bounces back, and the information that gets back to the circle (radar) tells us what we need to know about that object (cloud), including distance, speed, and direction. This can be used for detecting cloud movement and height, precipitation, hail size, tornado rotation, mesocyclones, and more.
METAR Observations
METAR stands for METerological Aerodrome Report, used by weather forecasters and pilots. Here is a sample METAR from the Chicago, Ohare airport:
METAR KORD 272351Z 07010KT 10SM FEW250 FEW300 12/03 A3014 RMK AO2 SLP210 T01170028 10139 20117 53002
Let's dissect it:
METAR – type of weather report. Taken in the last five minutes of the hour, every hour.
KORD – station identifier. K is typically the first letter of every US airport.
27 – day of the month.
2351Z – time of day in Zulu.
07010KT – wind direction and speed in knots. 070 is southeast. 10 is the speed.
10SM – visibility in statute miles.
FEW250 FEW300 – cloud amount and height in thousands of feet. Few clouds at 25,000 and 30,000 feet. Likely cirrus clouds.
12 – temperature in Celsius.
03 – dewpoint in Celsius.
A3014 – altimeter in inches of mercury. This is 30.14. Very stable.
RMK – start of remarks.
AO2 – automated, direct from the sensor, no weather forecaster has touched it.
SLP210 – sea level pressure in millibars. This is 1,021.0 millibars. Very stable.
T[01170028] – T is the group indicator for the hourly temperature and dewpoint rounded to the nearest tenth in Celsius.11.7 C temperature, 2.8 C dewpoint is cool and dry.
1[0139] – 1 is the group indicator for the 6-hourly maximum temperature to the nearest tenth in Celsius. 13.9 C is the 6-houry maximum temperature.
2[0117] – 2 is the group indicator for the 6-hourly minimum temperature to the nearest tenth in Celsius.11.7 C is the 6-hourly minimum temperature.
5[3002] – 5 is the group indicator for the pressure tendency changes in tenths of hectopascals. 3 means that the pressure is decreasing or steady, then increasing, or increasing then increasing more rapidly. 002 means the difference in changes are in .005 inches of mercury.
So…what does this tell us?
As a weather forecaster for this location, all the information from this METAR shows a picture of a very stable atmosphere. Light winds, unrestricted visibility, dry and cool temperatures as expected in the night and this time of year, thin, high clouds, very stable altimeter setting and sea level pressure, and an increasing pressure tendency which the higher the more stable the atmosphere.